About
This a python library for creating chess visualizations within matplotlib. This is useful if you need to create custom visualizations. For example, plotting the probability distributions over different moves for a given board.
Usage
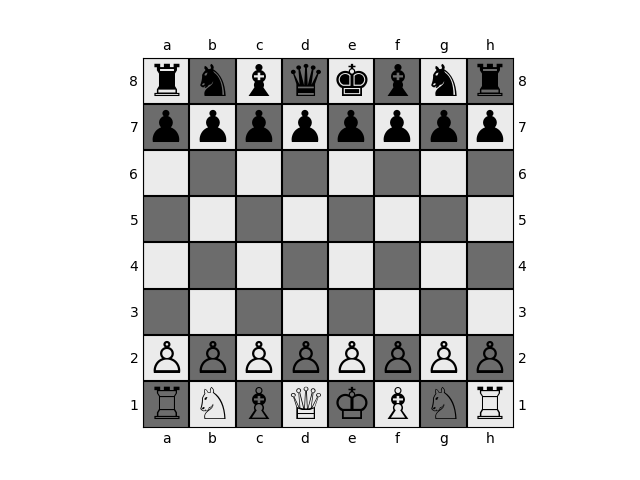
This library is built on top of objects from python-chess. You can intialize a plot
with a specific board using plot_board.
import chess
from chessplotlib import plot_board, plot_move
import matplotlib.pyplot as plt

board = chess.Board()
ax = plt.gca()
plot_board(ax, board)
plt.show()
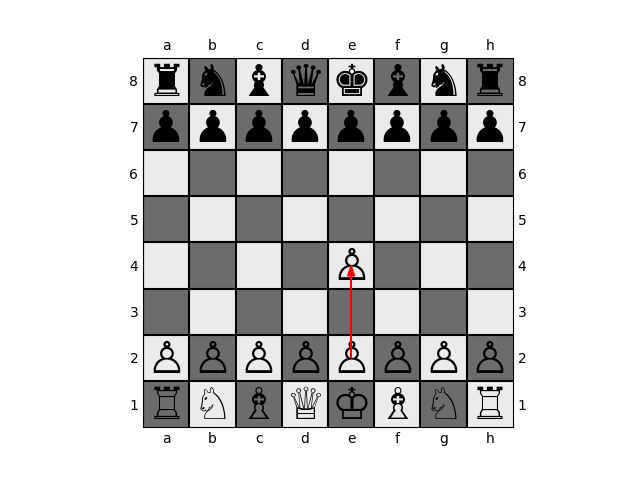
Now, we can plot on top of this axis to add more visualizations. We can
visualize a move with plot_move.
plot_move(ax, board, 'e2e4')
plt.show()
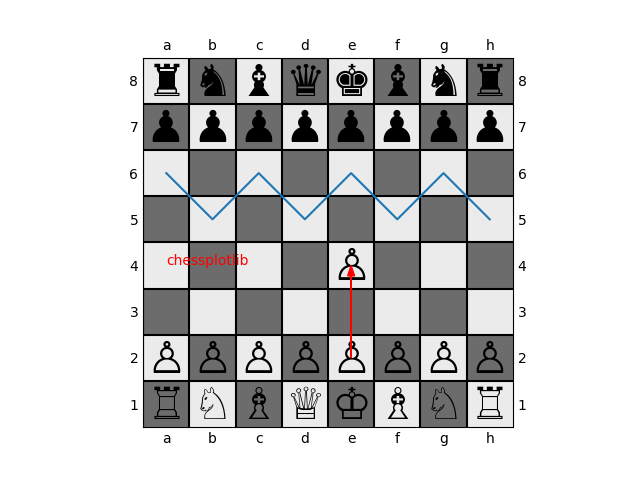
Then, you can add whatever else you would like using matplotlib,
plt.plot(range(8), [2, 3, 2, 3, 2, 3, 2, 3])
ax.text(0, 4, "chessplotlib", color='red')
plt.show()
pgn-viewer: A Simple PGN Viewer
This library also comes with a simple, minimal PGN viewer, pgn-viewer.
This is a CLI tool to visualizing games from a PGN file in the terminal. Once
you installled the package you can run:
$ pgn-viewer <pgn file>
This will start plotting the game move by move. You can move forward and
backward in time with the arrow keys and quit with q. You can also
run:
$ pgn-viewer --help